
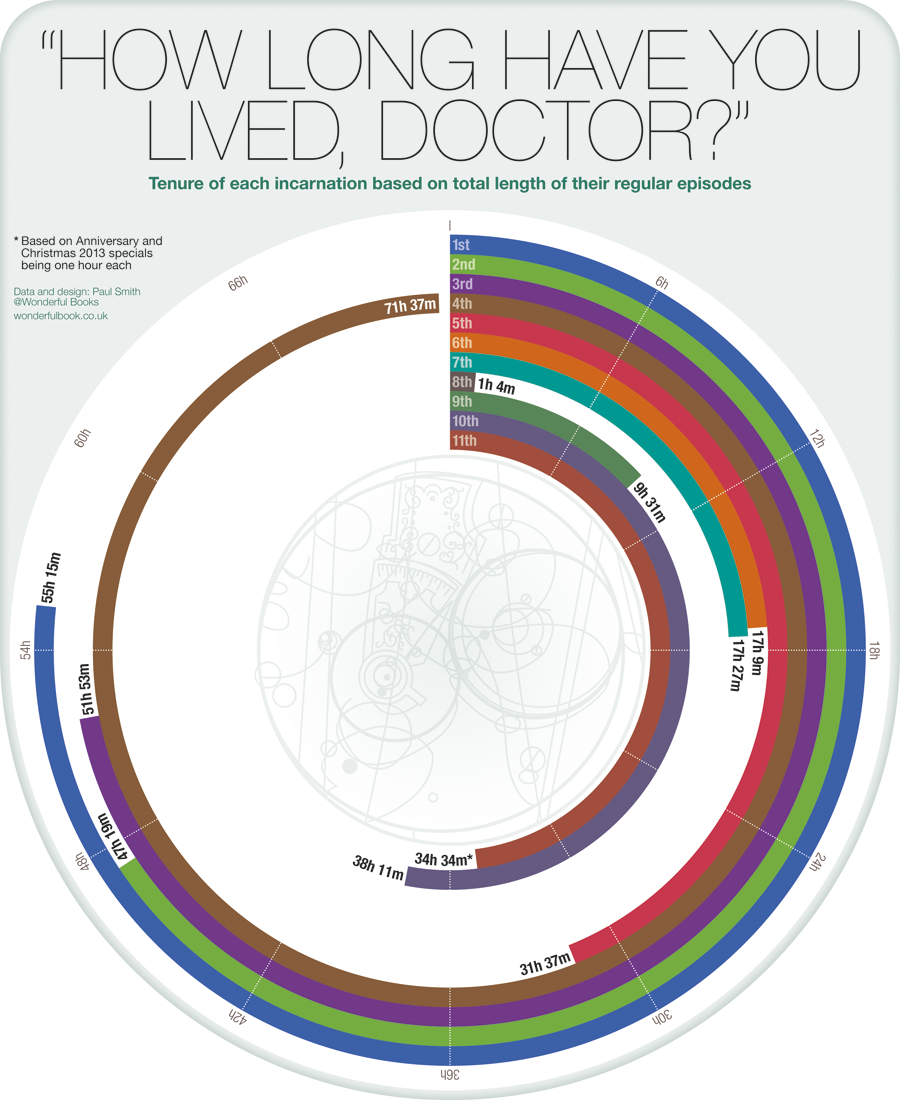
Paul Smith at Wonderful Books has produced a stunning Doctor Who infographic showing the tenure of each incarnation of the Doctor based on the total duration of their episodes to date.
Tom Baker’s Fourth Doctor has notched up the most adventures, with 71 hours and 37 minutes.
Time & Space Visualiser: The Story and History of Doctor Who as Data Visualisations is out now.
Who’s your favourite Doctor? Let us know below…